S-HIS NESR Plots (150223)
rdr20150223T195526end20150223T233728sdr20150224T123710
Plot Description
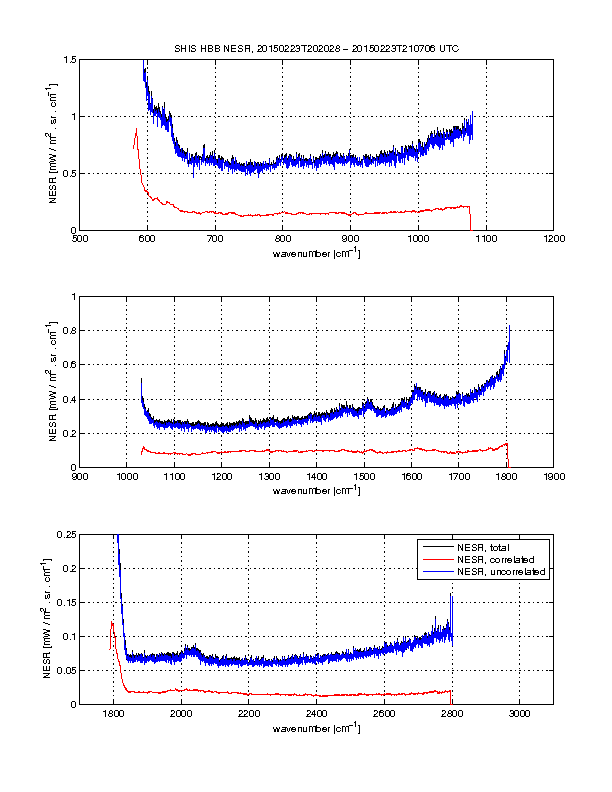
The top plot displays the NESR for the HBB calibration view, for all views that have been flagged as good by the processing pipeline.
The table below contains 9 plots. To characterize the change in NESR over time, the total data period has been divided into smaller intervals of time.
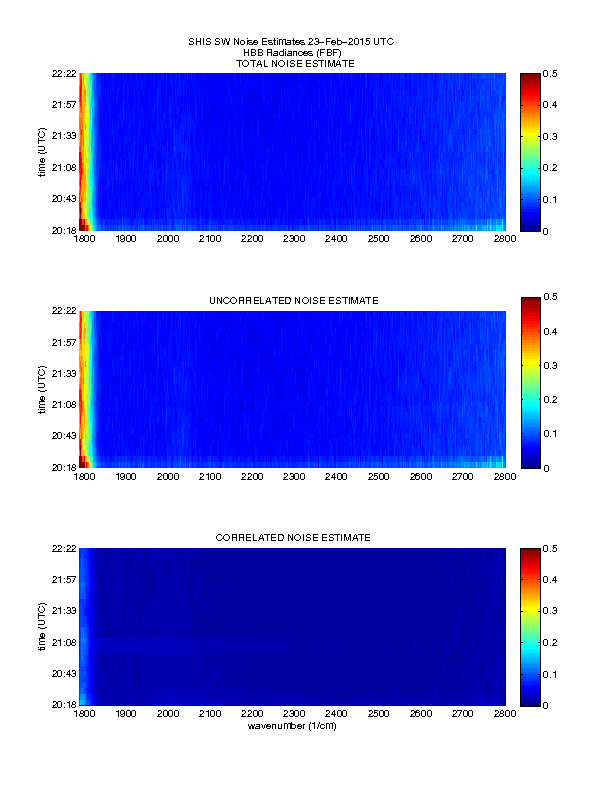
- Row 1: Noise Spectrograms (Total, Correlated, Uncorrelated)
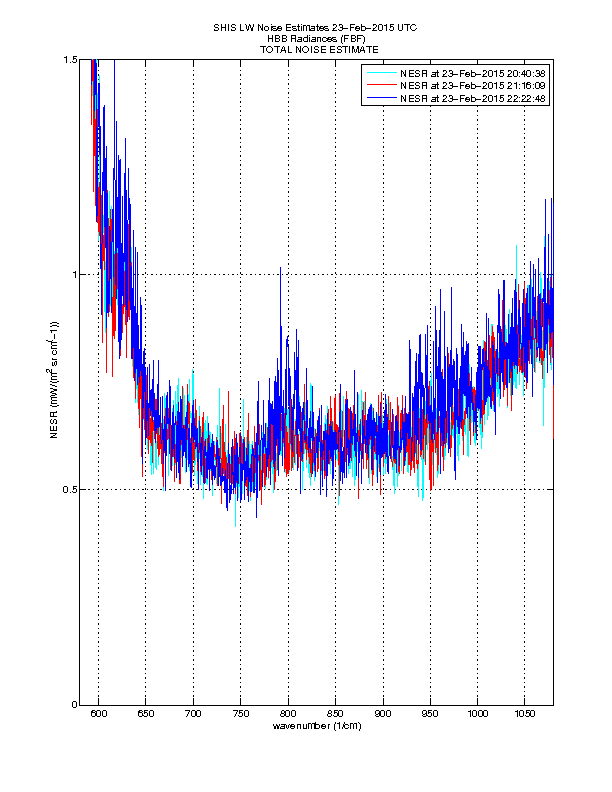
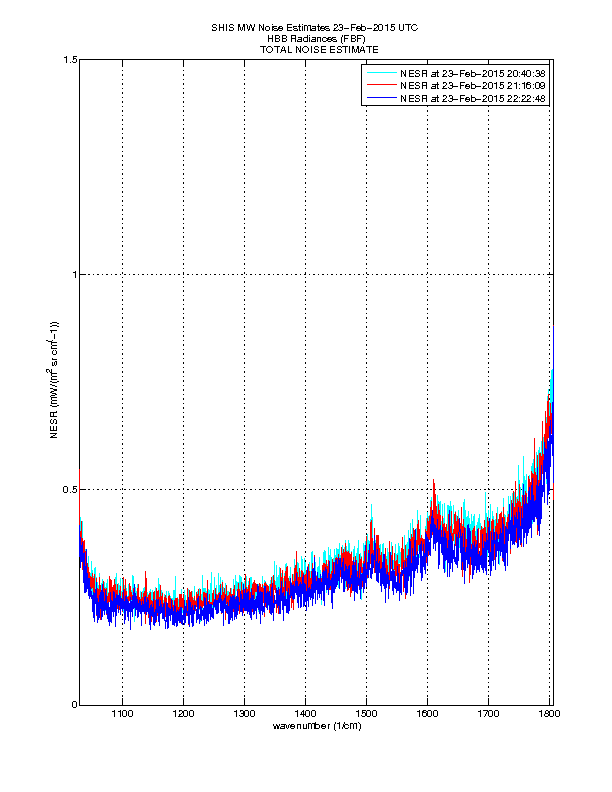
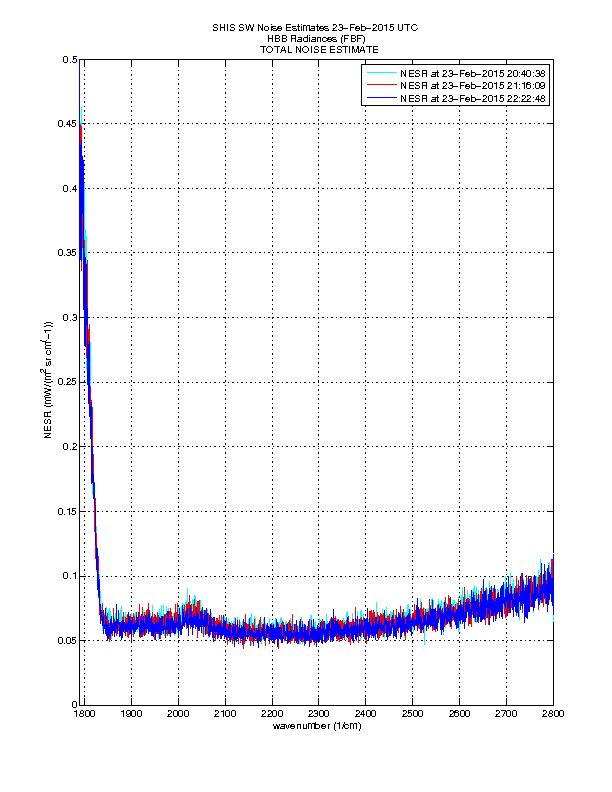
- Row 2: Total Noise at beginning, midpoint, and end of at altitude time
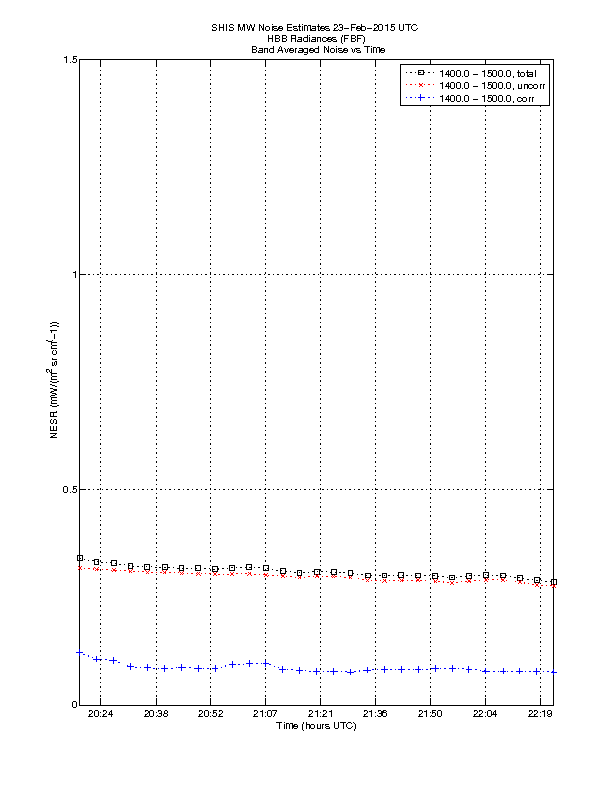
- Row 3: Band averaged Noise vs Time
- Column 1: Longwave band
- Column 2: Midwave band
- Column 3: Shortwave band